|
Seismic Refraction Surveys
Seismic Application Include
|
General geologic structure |
Faults and other hazards |
Landfill investigation |
Overburden thickness |
Rock rippability and quality |
Water table depth |
Bedrock depth |
Seismic refraction investigates the subsurface by generating arrival time and offset distance information to determine the path and velocity of the elastic disturbance in the ground. The disturbance is created by shot, hammer, weight drop, or some other comparable method for putting impulsive energy into the ground. Detectors, laid out at regular intervals, measure the first arrival of the energy and its time. The data are plotted in time distance graphs from which the velocities of the different layers, and their depths can be calculated. This is possible because rays (a continuum points on the expanding wave front) of the disturbance wave follow a direct route and is the first arrival energy at the closein geophones. The rays are refracted across layer boundaries where there is a difference in elastic and density properties. The critically refracted ray travels along the layer interface, at the speed of the lower layer, and continuously feeds energy back to the surface, to be successfully detected by the line of geophones. At some distance the refracted ray becomes the first arrival.
|
Shots are normally collected at evenly spaced
intervals throughout the entire length of the line in
order to increase coverage and generally determine
whether or not the layering is horizontal, dipping or
undulating. The acquired data are computationally
intense. A raytracing computer program is used
to iteratively honor all traveltimes and velocities, and
to be able to consider a large number of layers or
velocity contrasts where they are present. A first
energy arrival picking program, with such features
as zoom, filtering, time stretching, separation of
traces, AGC and balancing of traces, is also
applied. |
|
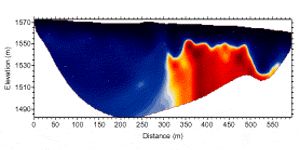
Seismic refraction tomogram of a salt diapir in central Utah. Hot
colors correspond to higher velocities, i.e., salt. Cool colors
delineate shale. |
|
|
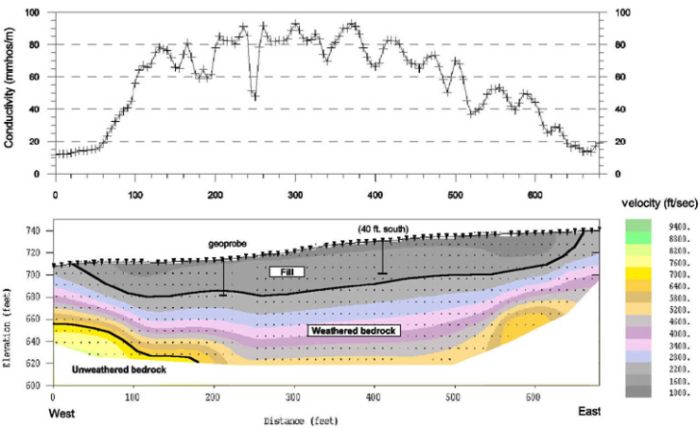
EM31 data and seismic refraction data demonstrating the limits of a landfill |
|
|